CostNav is the first navigation benchmark that evaluates robots the way businesses actually evaluate
them: by profit per run.
Instead of just measuring success rates, CostNav asks: How much did that navigation cost? How much
revenue did it generate? When will this system become profitable?
Abstract
Current navigation benchmarks focus on task success but do not capture the economic
constraints essential for commercializing autonomous delivery systems. We introduce
CostNav, an Economic Navigation Benchmark that evaluates physical AI
agents on a cost-revenue and break-even analysis, pairing Isaac Sim's collision and cargo
dynamics with industry-standard data such as Securities and Exchange Commission (SEC) filings
and Abbreviated Injury Scale (AIS) injury reports.
To our knowledge, CostNav is the first physics-grounded economic benchmark to use
regulatory and financial data to quantify the gap between navigation metrics and
commercial deployment, revealing that high task-success rates alone do not ensure
economic viability.
Evaluating seven baselines (two rule-based and five imitation-learning methods), we find no
method economically viable: all yield negative contribution margins. CANVAS, using only an RGB
camera and GPS, attains the highest task success and the least-negative margin among methods
with non-zero Service-Level Agreement (SLA) compliance (−$28.40/run), outperforming
LiDAR-equipped Nav2 w/ GPS (−$37.34/run).
A sim-trained policy evaluated on a real delivery robot yields SLA compliance close to its
simulation result, indicating that policy performance in CostNav's simulation transfers to
real-world deployment.
We challenge the community to achieve economic viability on CostNav, which scores methods by
cost-revenue outcomes.
All resources are available at
https://github.com/worv-ai/CostNav.
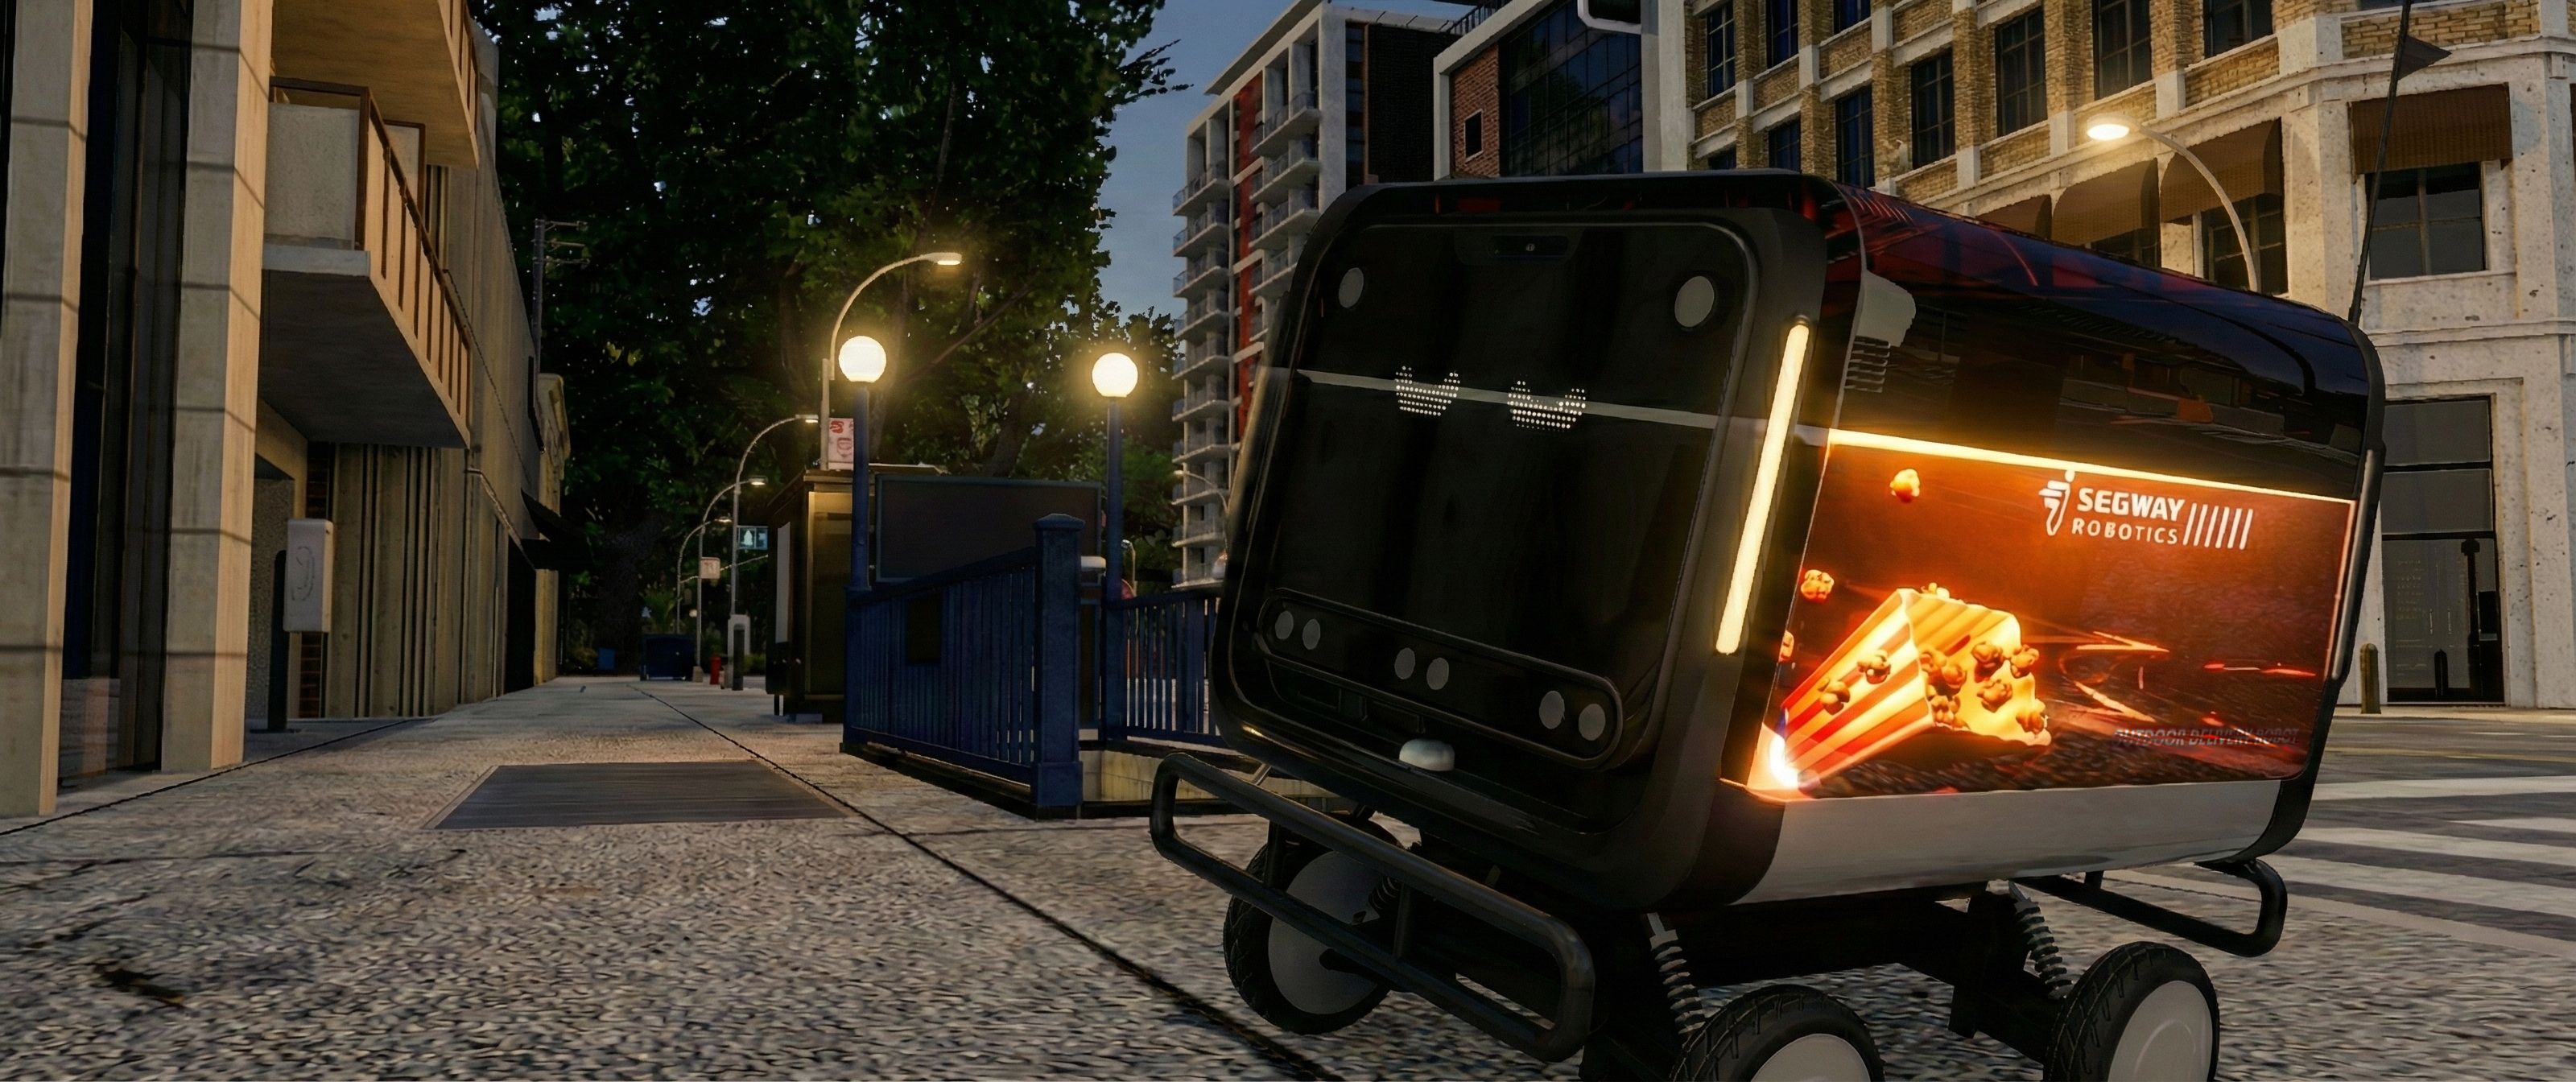
The Problem: Optimizing for the Wrong Things
This scene is captured directly from CostNav's simulation environment, with lighting enhancements.
Traditional navigation benchmarks celebrate high navigation success rates and path efficiency, and people try to improve these metrics.
But these metrics do not answer the questions that determine commercial viability:
Do I invest $3,000 in LiDAR for a classical Nav2 pipeline, or rely on the robot's
built-in RGB camera for a learning-based approach?
What compensation cost should I budget when the robot spills food even if it reaches the
destination?
What is the true cost per delivery after energy, maintenance, crashes, and customer
service compensation?
How many deliveries are required to break even on the upfront investment?
Prior benchmarks don't answer these questions. CostNav does.
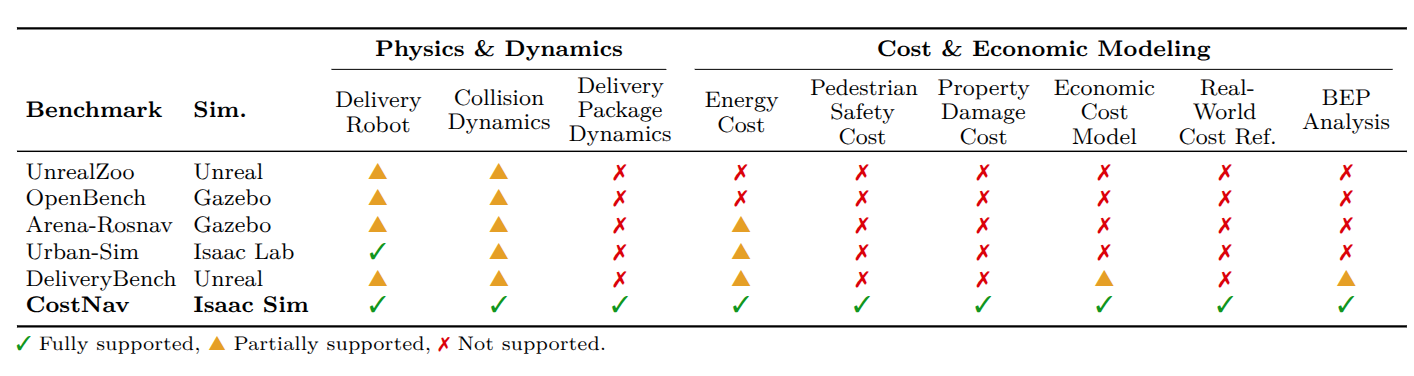
How CostNav Differs from Existing Benchmarks
Existing navigation benchmarks (UnrealZoo, OpenBench, Arena-RosNav, Urban-Sim, DeliveryBench)
evaluate agents primarily on task-oriented metrics such as success rate and path efficiency,
without modeling cost-revenue dynamics essential for commercial deployment.
CostNav is the first benchmark to combine high-fidelity physics simulation (Isaac Sim with
full collision dynamics, delivery package dynamics, and cargo intactness modeling) with a
comprehensive economic cost model grounded in real-world data sources—including
energy costs, pedestrian safety costs, property damage, service compensation, repair costs,
and break-even point analysis.
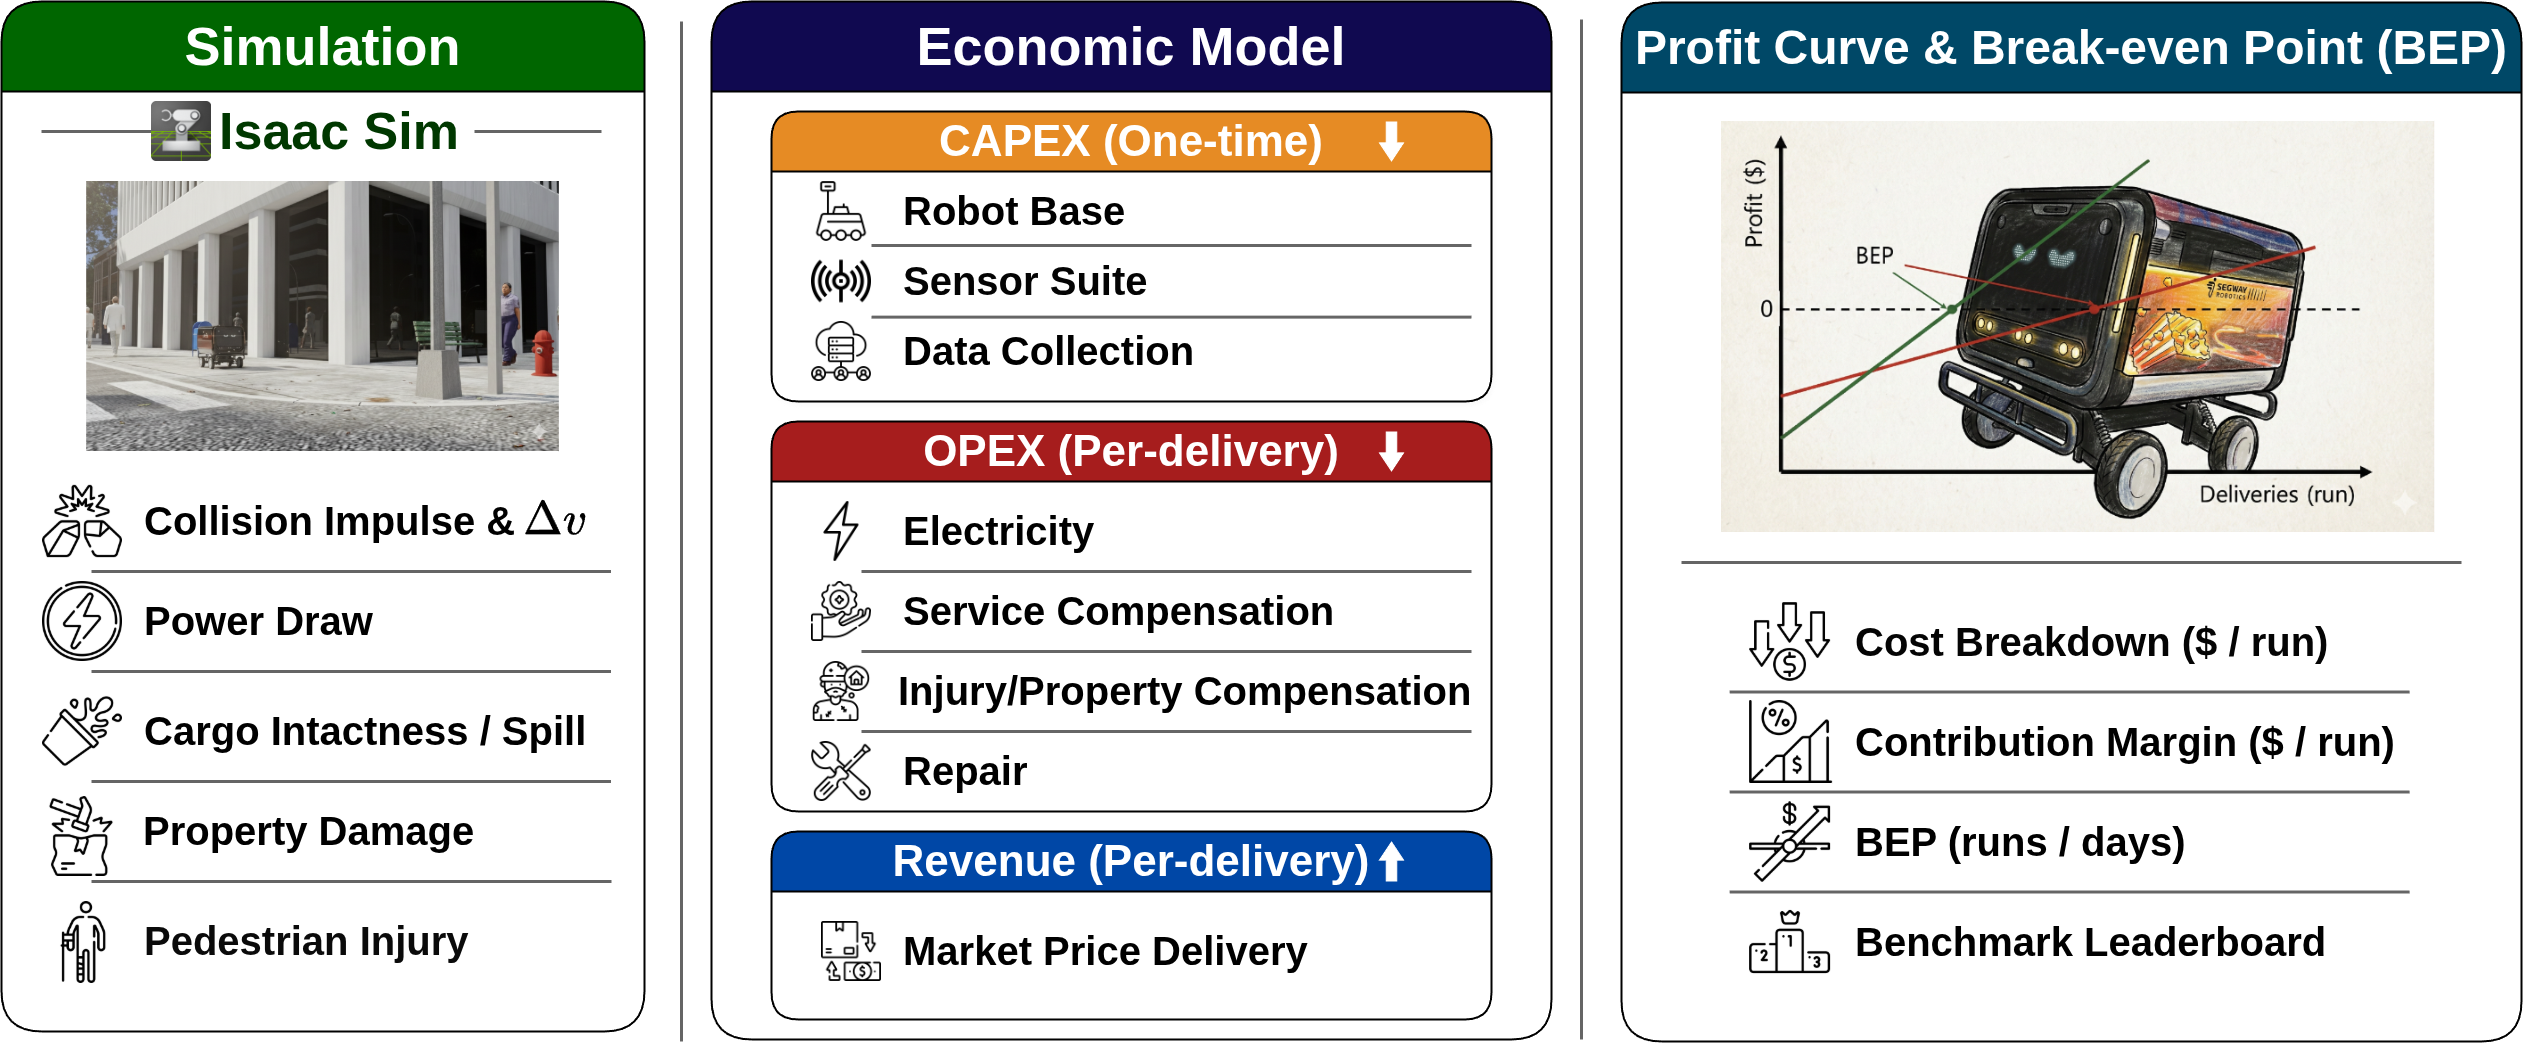
CostNav: Measuring the Real-World Profitability of Physical AI
We introduce CostNav, an Economic Navigation Benchmark for Physical AI. It links
navigation performance to business value by measuring profit per run: delivery revenue minus
the full cost of operation.
High-Fidelity Physics Simulation for effective Real-World Economic Scenarios
CostNav uses Isaac Sim (PhysX 5 + Newton) and prices physical interactions. Collisions are
evaluated via impulse and delta-v mapped to the AIS injury scale, while jerk-induced
spoilage and hardware wear capture non-obvious costs beyond geometric success.
Cost-revenue model and break-even analysis
The framework separates CAPEX from per-run OPEX (energy, maintenance, collisions, and
service compensation). Revenue follows real pricing and SLA compliance: timeouts earn zero,
and food intactness determines service completeness. This yields break-even analysis (BEP)
for how many deliveries recover fixed costs.
Real-world Grounded Parameters combined with Detailed Physics Simulation Outcomes
Real-world parameters (pricing, labor, energy, maintenance, incident costs, ops ratios, and
failure rates) are paired with simulation outputs (runtime, power, distance, collisions,
assistance, and spoilage) to compute per-run costs, revenue, profit, and BEP. Sources
include manufacturer pricing/spec sheets for robots and sensors, SEC filings for fleet
throughput and assistance rates, U.S. wage and electricity statistics, delivery-platform
pricing and refund data, AIS/NHTSA injury cost reports, and municipal repair cost records.
CostNav's high-fidelity physics simulation enables the modeling of real-world economic scenarios,
including critical failures like food spoilage and robot rollovers.
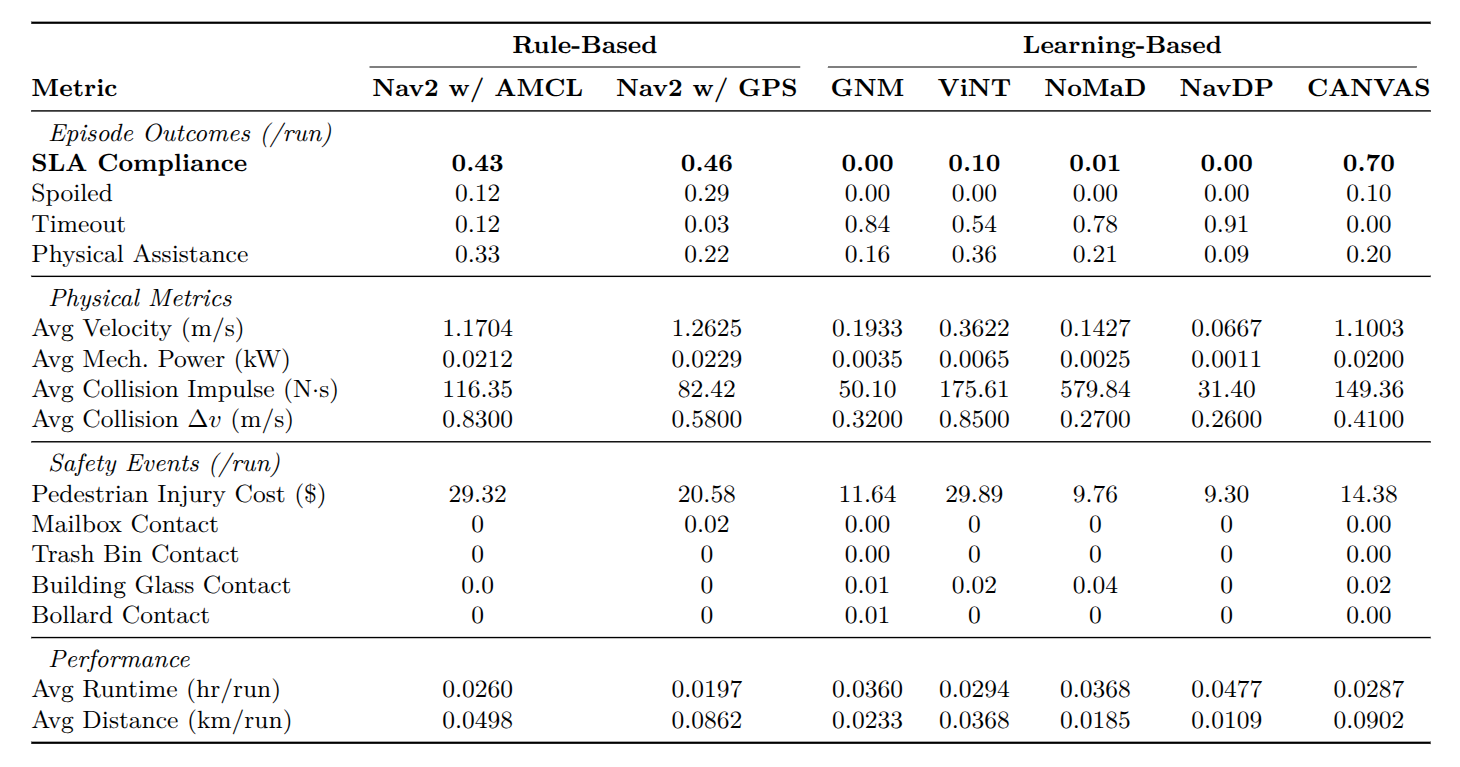
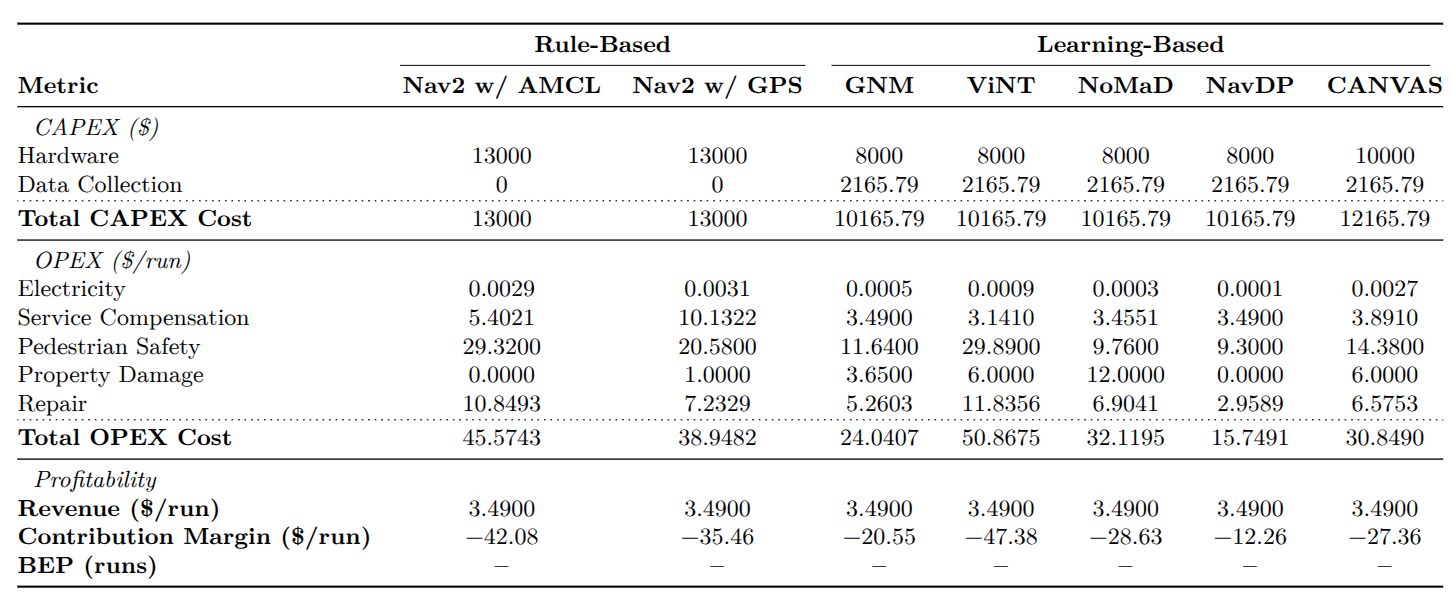
Results
We evaluate seven baselines—two rule-based (Nav2 w/ AMCL, Nav2 w/ GPS) and five
learning-based (GNM, ViNT, NoMaD, NavDP, CANVAS)—over 100 delivery episodes on
urban sidewalk scenarios. Learning-based methods rely primarily on RGB cameras
(NavDP additionally uses depth, CANVAS additionally uses GPS), while the rule-based
Nav2 baselines use a 360° 3D LiDAR with GPS.
Overall Economic Performance
No evaluated method is economically viable. All seven methods yield
negative contribution margins, resulting in no finite break-even point (BEP).
The best-performing method is CANVAS at −$28.40/run, equipped with only an RGB camera
and GPS, outperforming LiDAR-equipped Nav2 w/ GPS (−$37.34/run).
Pedestrian safety costs are the dominant operational cost across all methods, ranging from
$9.30/run (NavDP) to $29.89/run (ViNT).
Cost Breakdown Analysis
The cost breakdown reveals that pedestrian injury costs and service compensation dominate
OPEX across all methods. Even CANVAS, the best learning-based method, incurs $14.38/run
in pedestrian costs. This underscores the critical importance of robust pedestrian
avoidance for commercial viability.
Comparison Video
Side-by-side comparison of rule-based and learning-based navigation methods in CostNav's
urban sidewalk environment.
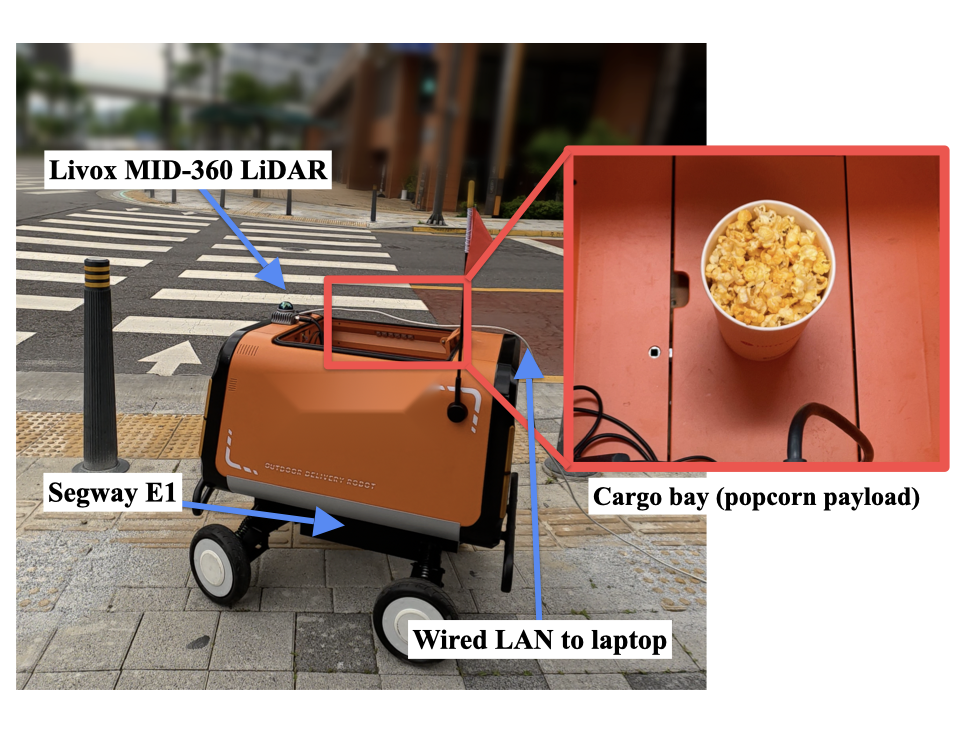
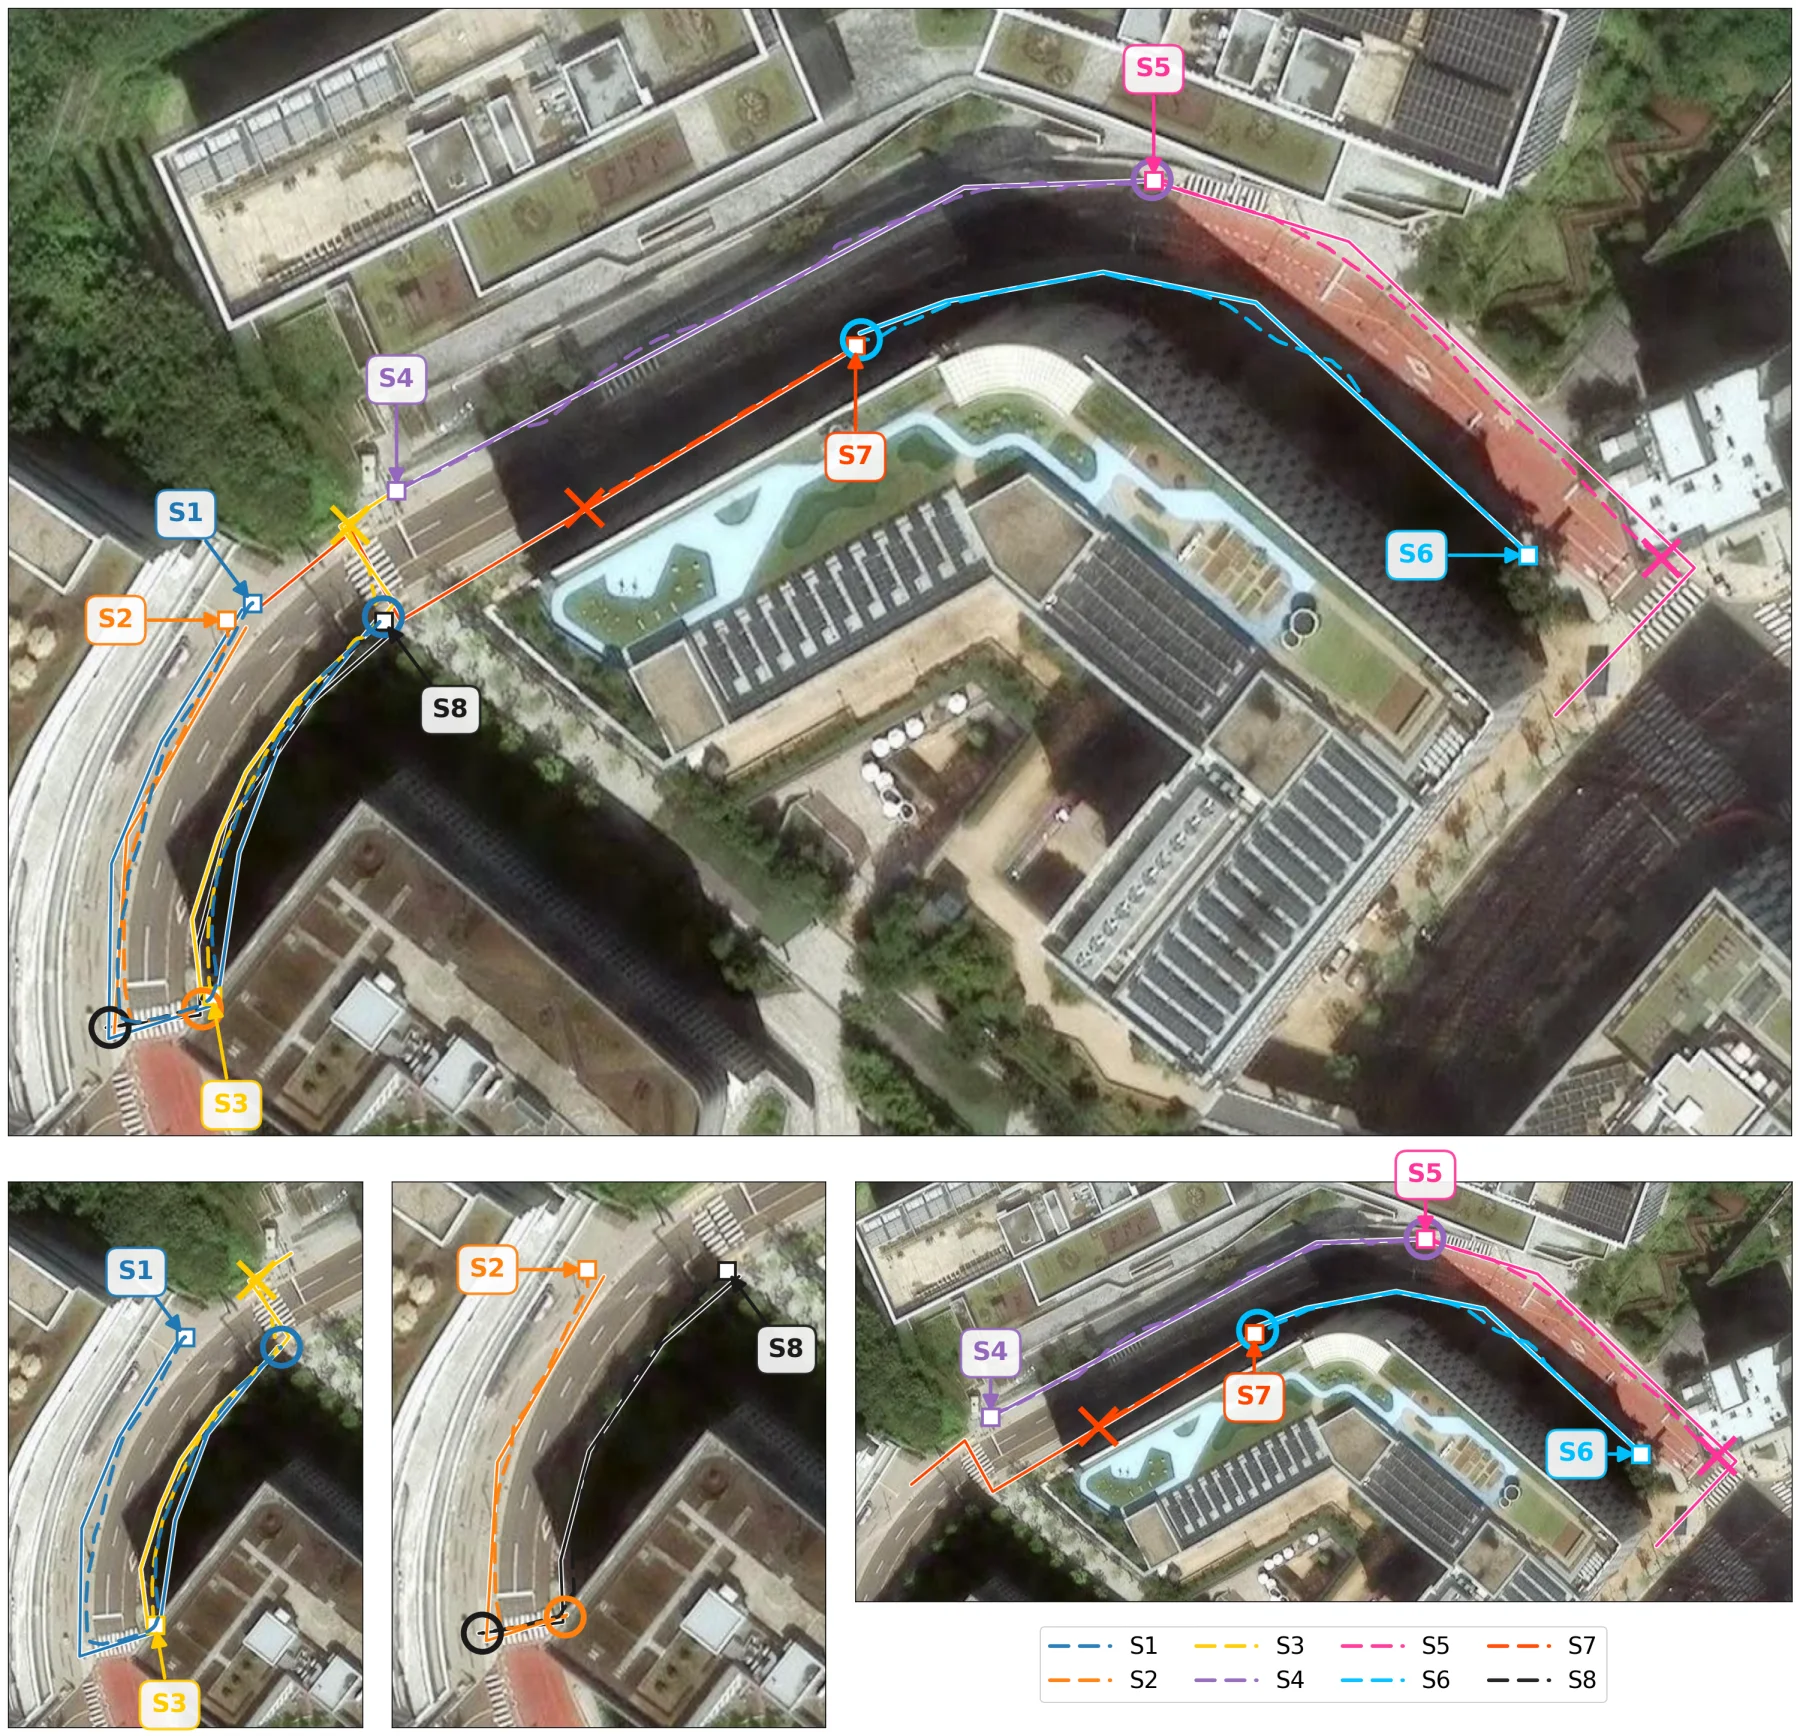
Sim-to-Real Performance
Across 8 real-world delivery scenarios on a physical Segway E1 along an outdoor urban
sidewalk route, the sim-trained CANVAS policy achieved 63% SLA compliance,
close to the 70% observed in simulation. On the real platform, localization
used LiDAR-Inertial Odometry (LIO) rather than GPS. Failures involved contact
with vegetation or a fence, and one vegetation contact also spoiled the cargo. This close match
between simulated and real-world SLA compliance shows that CostNav's physics is adequate to
reproduce benchmark performance on physical hardware,
supporting the simulation benchmark as a proxy for real-world deployment:
economic metrics computed in simulation reflect behavior observable on physical hardware.
Real-world experimental platform. A Segway E1 sidewalk delivery robot with a Livox MID-360 LiDAR, running the sim-trained CANVAS policy. Right inset: cargo bay with a popcorn-cup payload.All 8 scenarios on the outdoor sidewalk route. Solid lines: planned waypoint paths. Dashed lines: actual robot path (LiDAR-localized pose). Markers: ■ start, ◯ successful arrival, × crash (S3 plant, S5 plant with spoiled cargo, S7 fence).
Per-Scenario Videos
The sim-trained CANVAS policy running on the real Segway E1, shown one scenario at a time.
S1 — Success · Playback is sped up 3×
S2 — Success · Playback is sped up 3×
S3 — Crash (plant) · Playback is sped up 3×
S4 — Success · Playback is sped up 3×
S5 — Spoiled (plant + spilled food) · Playback is sped up 3×
S6 — Success · Playback is sped up 3×
S7 — Crash (fence) · Playback is sped up 3×
S8 — Success · Playback is sped up 3×
Why This Matters
For Entrepreneurs
CostNav reports break-even and cost-revenue analysis for each method, making deployment
trade-offs—such as whether a more expensive sensor is justified—explicit
rather than assumed.
For Engineers & Researchers
CostNav lets methods be optimized for deployment cost, not only task success. It supports
studying cost-aware objectives and sensor cost–performance trade-offs alongside
conventional navigation metrics.
For the Future of Autonomous Systems
CostNav links navigation performance to economic viability. As our results show, a method
with high task success can still be economically unviable, so viability is a distinct
axis worth measuring.
The Vision
CostNav treats economic viability as a first-class evaluation axis for
navigation: optimizing for cost per delivery and using
break-even analysis to compare approaches, alongside accuracy and
success-rate metrics.
Traditional metrics remain important but are incomplete. In our evaluation, methods that
reach the destination in many episodes still operate at a negative contribution margin, so
task success alone does not indicate an economically deployable system.
Get Involved
We release the full benchmark for the community to build on:
The technical report and benchmark framework
Real-world referenced, cost and revenue formulas for break-even point analysis
An Isaac Sim environment featuring realistic physics, collision dynamics, and a Segway E1
delivery robot navigating an urban setting with pedestrians
A human-collected teleoperation dataset
Evaluation code and our baselines
We welcome contributions and extensions from the community.
Coming Soon
Additional maps and robot platforms
Expanded scenarios testing robustness under challenging conditions
Open challenges for the community to beat our baselines
CostNav adds an economic dimension to navigation evaluation, with the aim of connecting
navigation research to the requirements of real-world deployment.
@misc{seong2026costnavnavigationbenchmarkrealworld,
      title={CostNav: A Navigation Benchmark for Real-World Economic-Cost Evaluation of Physical AI Agents},
      author={Haebin Seong and Sungmin Kim and Yongjun Cho and Myunchul Joe and Geunwoo Kim and Yubeen Park and Sunhoo Kim and Samwoo Seong and Yoonshik Kim and Suhwan Choi and Jaeyoon Jung and Jiyong Youn and Jinmyung Kwak and Sunghee Ahn and Jaemin Lee and Younggil Do and Seungyeop Yi and Woojin Cheong and Minhyeok Oh and Minchan Kim and Seongjae Kang and Youngjae Yu and Yunsung Lee},
      year={2026},
      eprint={2511.20216},
      archivePrefix={arXiv},
      primaryClass={cs.AI},
      url={https://arxiv.org/abs/2511.20216},
}